| Concept | Description |
|---|---|
| Install Choices | |
| Installation Options | Two install paths suiting personal machines and enterprise rollouts |
| System Requirements | Supported Windows versions, RAM, and disk recommendations |
| Microsoft Store | Auto-updating install path managed through Windows Update |
| Standalone Installer | Manually-downloaded MSI suited for IT-controlled environments |
| Updates and Versions | Monthly release cadence and how to track release notes |
| Setup Walkthrough | |
| Sign-In Account | Microsoft work or school account used for the Service |
| First Launch | Welcome screen, sample reports, and the Get Data button |
| Initial Settings | Locale, regional settings, and feature previews to enable |
3 Installing and Configuring Power BI Desktop
3.1 Installing Power BI Desktop
Power BI Desktop is a free application that allows users to connect, transform, and visualize data. Follow these step-by-step instructions to download and install Power BI Desktop on your PC.
Step 1: Check System Requirements
Before installing Power BI Desktop, ensure your PC meets the following minimum and supported requirements.
- Supported Operating Systems
- Windows 10
- Windows 11
- Windows Server 2016
- Windows Server 2019
- Minimum Hardware Requirements
- Processor: 1.6 GHz or faster
- RAM: 4 GB (8 GB recommended)
- Disk Space: At least 2 GB available
- Additional Software Requirements
- Internet Explorer 10 or greater
- Available for 32-bit (x86) and 64-bit (x64) systems
Step 2: Download Power BI Desktop
ImportantWatch: Downloading and Installing Power BI Desktop
The video above walks through the complete download and installation process step by step.
-
Open your web browser and go to the official Microsoft Power BI download page:
Click on Download .
The file PBIDesktopsetup_X64.exe will be downloaded to your PC.
Step 3: Install Power BI Desktop
Once the download is complete, locate the .exe installation file in your Downloads folder.
Double-click the file to launch the installation wizard.
-
Follow the on-screen instructions:
- Click Next to proceed.
Click on Yes
Click Next to proceed.
Accept the license agreement and Click Next to proceed.
Choose the installation location (default is recommended) and click Yes.
Click create desktop shortcut and click install to begin the installation process.
Wait for the installation to complete.
Click launch power bi desktop and and then click Finish
Step 4: Launch Power BI Desktop
Go to the Start Menu and search for Power BI Desktop.
Click on the application to open it.
Click on Blank Report to open an empty Power BI file.
You’re now ready to start using Power BI Desktop 🥳
3.2 Installing Power BI Desktop on Apple Mac OS
NotePower BI Desktop and Mac OS
Power BI Desktop is a Windows-only application and does not have a native Mac installer. Mac users have four practical options to access the full Power BI Desktop experience or a browser-based alternative. Each option suits a different setup, so choosing the right one depends on your Mac model, your organization’s infrastructure, and how frequently you plan to use Power BI.
3.2.1 Option 1 — Parallels or VMware Fusion
NoteRunning Windows on Your Mac via Virtualization
Parallels Desktop and VMware Fusion allow you to run a full Windows environment inside a window on your Mac, giving you complete access to Power BI Desktop without restarting. This is the recommended option for most Mac users, including those on Apple Silicon (M1, M2, and M3).
Steps to Set Up
- Download Parallels Desktop from parallels.com or VMware Fusion from vmware.com (both are paid applications)
- Install the application and launch the setup wizard
- Create a new Windows 11 Virtual Machine — Parallels can download Windows automatically during this step
- Complete the Windows installation inside the virtual machine
- Open a browser inside Windows and go to microsoft.com to download and install Power BI Desktop
- Launch Power BI from within your Windows session on the Mac
Advantages
Parallels and VMware provide the full Power BI Desktop experience and work seamlessly on Apple Silicon Macs. You can switch between Mac and Windows without restarting, making it practical for everyday use.
Things to Note
Both applications require a paid licence. Parallels includes a Windows licence in some plans, but you should confirm this before purchasing. Running a virtual machine consumes additional RAM, so a Mac with at least 8 GB of memory is recommended.
3.2.2 Option 2 — Boot Camp (Intel Macs Only)
NoteDual-Booting Windows on Intel Macs
Boot Camp is a free utility built into macOS that lets Intel Mac users install Windows natively on a separate partition. This gives you full, native Windows performance without any virtualization overhead. Boot Camp is not available on Apple Silicon (M1, M2, M3) Macs.
Steps to Set Up
- Confirm your Mac runs an Intel processor — Boot Camp is not supported on M1, M2, or M3 Macs
- Download a Windows 11 ISO from microsoft.com/software-download
- Open Boot Camp Assistant from Applications > Utilities
- Follow the wizard to partition your drive — allocate a minimum of 64 GB for the Windows partition
- Boot Camp will guide you through the Windows installation using your ISO
- Once Windows is installed, boot into it and install Power BI Desktop normally
Advantages
Boot Camp delivers native Windows performance with no virtualization overhead. It is free to use (a valid Windows licence is still required) and gives you the complete Power BI Desktop experience.
Things to Note
Boot Camp requires an Intel Mac and is not compatible with Apple Silicon. You must restart your Mac every time you want to switch between macOS and Windows, which can interrupt your workflow.
3.2.3 Option 3 — Microsoft Remote Desktop
NoteConnecting Remotely to a Windows Machine
Microsoft Remote Desktop lets you connect from your Mac to a Windows PC, server, or cloud virtual machine (such as an Azure VM) that already has Power BI Desktop installed. The application is free from the Mac App Store and works on both Intel and Apple Silicon Macs.
Steps to Set Up
- Ensure you have access to a Windows machine (a PC, on-premises server, or cloud VM) with Power BI Desktop installed
- On your Mac, search for Microsoft Remote Desktop in the Mac App Store and install it — it is free
- Open the app and add your Windows PC by entering its name or IP address and your Windows login credentials
- Double-click the connection to launch the session — Power BI Desktop opens within the remote window
- Work as you normally would — all data and processing remain on the Windows machine
Advantages
No Windows licence is needed on your Mac. This option works on any Mac model including Apple Silicon, and is well suited for organizations with centralized Windows infrastructure where Power BI is already deployed.
Things to Note
The Windows machine or server must be running and accessible over the network. Performance depends on the speed and stability of your connection, making this option less suitable for offline work.
3.2.4 Option 4 — Power BI Service (Browser)
NoteUsing Power BI Entirely in the Browser
The Power BI Service at app.powerbi.com is a full browser-based analytics platform. It requires no installation and works on any Mac using Chrome, Safari, or Edge. This is the easiest option to get started and requires only a Microsoft account.
Steps to Get Started
- Open Chrome, Safari, or Edge on your Mac
- Go to app.powerbi.com and sign in with your Microsoft account
- Upload a dataset by connecting to Excel, CSV, or a cloud data source
- Use the online report builder to create and publish reports
- Share dashboards and collaborate with your team directly from the browser
What You Can Do
The Power BI Service lets you build and publish reports online, view and interact with dashboards, configure scheduled data refresh, and share reports with your team — all without installing anything.
Limitations Compared to Power BI Desktop
The browser-based experience does not include Power Query Editor for data transformation, M code, or the full range of local data source connections available in Power BI Desktop. An internet connection is required at all times.
3.2.5 Which Option Is Right for You?
NoteComparison of All Four Options
| Option | Best For | Mac Compatibility | Cost |
|---|---|---|---|
| Parallels / VMware | Full Desktop experience, regular users | All Macs including M1/M2/M3 | Paid licence required |
| Boot Camp | Best native performance | Intel Macs only | Free (Windows licence needed) |
| Remote Desktop | Teams with centralized Windows infrastructure | All Macs including M1/M2/M3 | Free app, Windows PC required |
| Power BI Service | Viewing, sharing, and light report building | Any Mac, any browser | Free with Microsoft account |
For most users, Parallels or VMware offers the best balance of full Desktop features and Mac compatibility. If you are on an Intel Mac and want maximum performance without any subscription cost, Boot Camp is the strongest alternative.
3.3 Configuring Power BI Desktop
Proper configuration of Power BI Desktop ensures accurate data interpretation, smooth performance, secure access, and a consistent analytics workflow.
After installation, several global and file-level settings must be reviewed to tailor Power BI for your organization’s requirements.
These configurations affect:
- Data loading behavior
- Modeling defaults
- Security and privacy
- Regional formats
- Performance optimization
- Integration with Power BI Service
Power BI settings can be accessed from:
File → Options and settings → Options
3.3.1 Global Settings
Global settings influence all reports you create in Power BI Desktop. These settings define how data loads, how models behave, and how Power Query processes sources.
Below are the important global settings to consider
Data Load
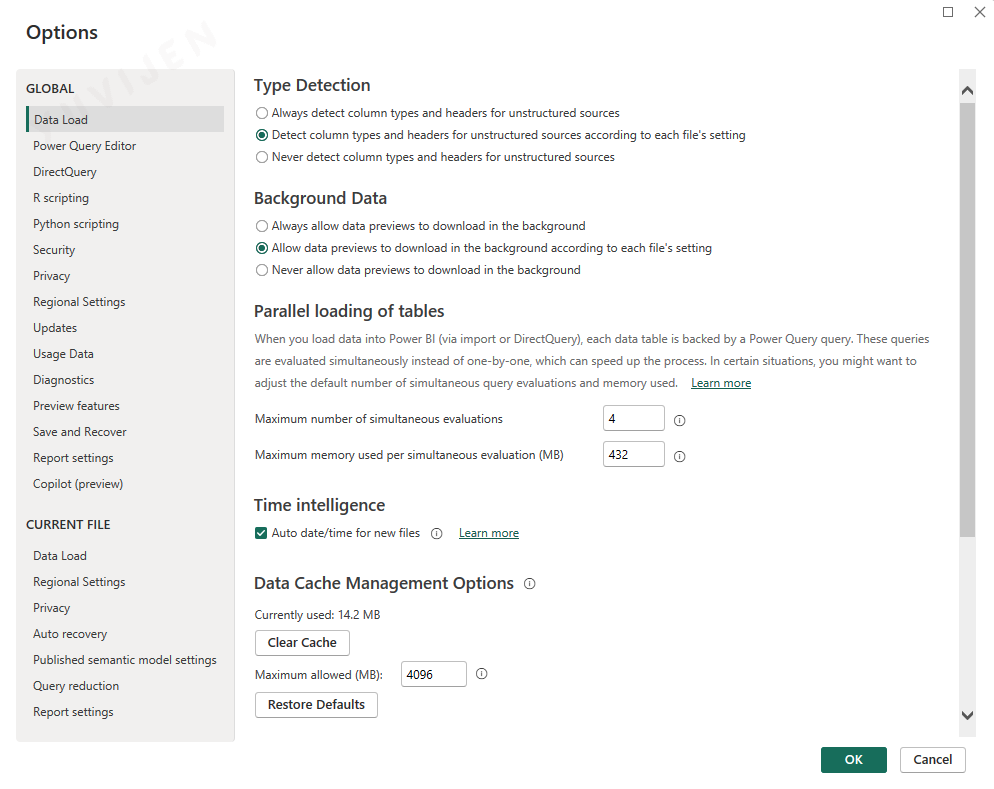
The Data Load settings in Power BI Desktop control how data types are detected, how previews are processed, and how Power BI manages memory and parallel evaluations. These options directly influence model performance, refresh speed, and the responsiveness of the Power Query Editor.
Recommended settings👇
Type Detection
Power BI can automatically detect column types and headers for unstructured sources such as CSV and text files. The available options are:
- Always detect column types and headers for unstructured sources.
-
Detect column types and headers for unstructured sources according to each file’s setting (default)
- Never detect column types and headers for unstructured sources
Automatic detection ensures that imported data is interpreted correctly.
Background Data
Controls how Power Query loads data previews during transformations:
- Always allow data previews to download in the background
-
Allow data previews to download in the background according to each file’s setting (recommended)
- Never allow data previews to download in the background
Enabling background previews helps maintain a smooth editing experience.
Time Intelligence
Power BI can automatically generate hidden date tables for columns that contain date values.
- Auto date/time for new files This is convenient for simple reports but optional for models that use a dedicated Date dimension.
Data Cache Management
Power BI stores temporary data to accelerate query previews and transformations.
- Viewing current cache usage
- Clear Cache button to free system memory
Clearing cache periodically can resolve slow performance or outdated preview issues.
Power Query Editor Settings
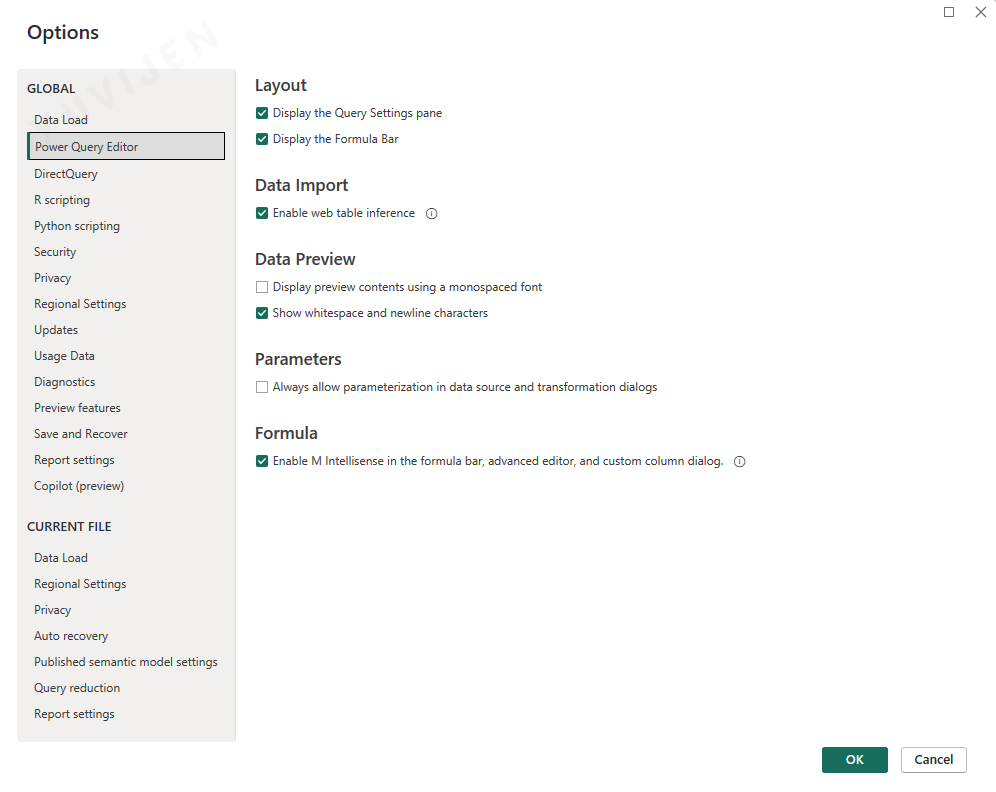
The Power Query Editor settings control how data previews, layout options, parameters, and formulas behave while you prepare and transform data.
These settings help maintain a clean and efficient ETL environment, improving your experience when working with large or complex datasets.
Layout
These options determine how the Power Query interface appears:
- Display the Query Settings pane
- Display the Formula Bar
Enabling the Formula Bar is helpful when writing or reviewing M code during transformations.
Data Import
This setting controls how Power BI interprets data retrieved from web pages:
- Enable web table inference
With this option enabled, Power BI automatically identifies structured tables on web pages, making web-based data extraction easier.
Data Preview
These settings affect how data previews appear in the Power Query grid:
- Display preview contents using a monospaced font
- Show whitespace and newline characters
Showing whitespace and line breaks is useful when handling text-cleaning tasks or validating source data.
Parameters
This setting affects parameter creation in Power Query:
- Always allow parameterization in data source and transformation dialogs
Enabling this option makes it easier to convert values into parameters for dynamic queries.
Formula
This option improves the coding experience when working with M formulas:
- Enable M Intellisense in the formula bar, advanced editor, and custom column dialog
M Intellisense provides auto-completion, syntax suggestions, and function hints to make writing M code faster and more accurate.
R Scripting
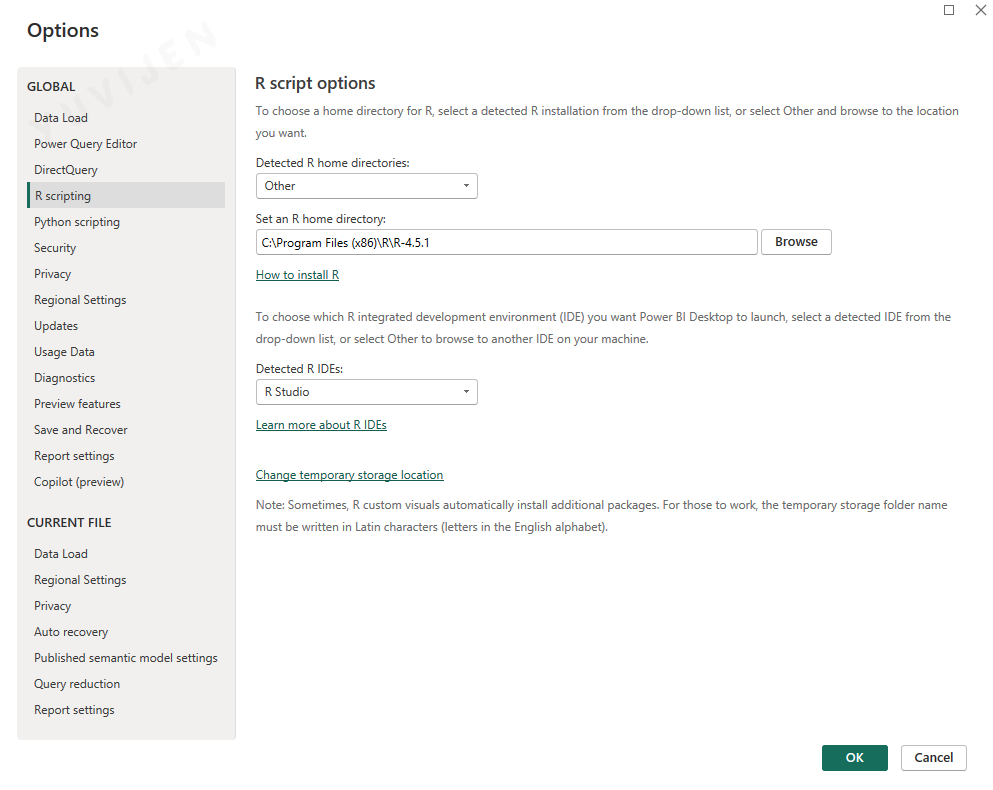
The R Scripting configuration in Power BI Desktop allows you to run R code for data transformation, statistical analysis, and custom visual creation.
This section enables you to specify the R installation, IDE preferences, and temporary storage settings used when executing R scripts inside Power BI.
Selecting the R Home Directory
Power BI needs access to a valid R installation to run scripts. You can choose an R directory in two ways:
- Select a detected installation from the Detected R home directories list.
- Choose Other and manually browse to the R folder on your system.
In the screenshot example, the selected path is: C:\Program Files (x86)\R\R-4.5.1
If R is not yet installed in your PC, Here is the 👉 : LINK
Choosing the R Integrated Development Environment (IDE)
Power BI allows you to specify which IDE should open when editing R scripts.
Available detected IDEs (depending on your system):
-
RStudio
- Visual Studio
- Other installed R IDEs
If RStudio is not yet installed in your PC, Here is the 👉 : LINK
Temporary Storage Location**
Power BI uses a temporary folder to store intermediate files generated during R script execution.
You can change this location using:
Configuring these options ensures that R scripts and custom visuals run smoothly inside Power BI Desktop.
Python Scripting
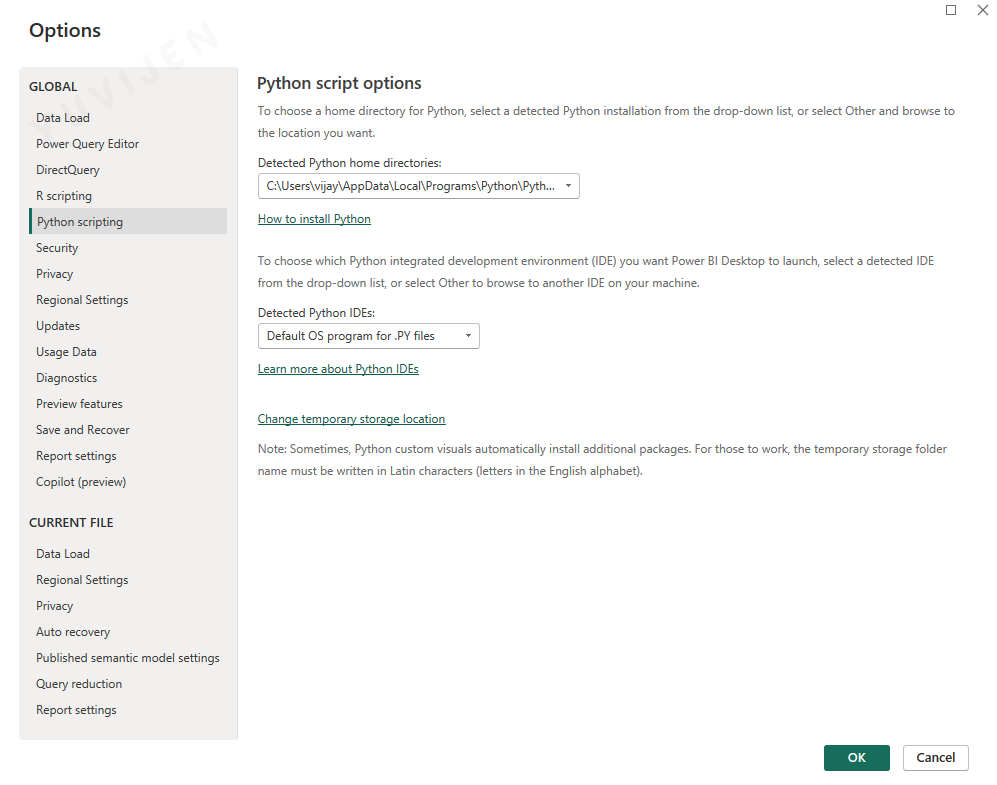
The Python scripting options in Power BI Desktop allow you to run Python code for data transformation, modeling, automation, and custom visual creation.
These settings let you specify the Python installation, choose an IDE, and manage temporary storage used during script execution.
Python Home Directory
Power BI requires access to a valid Python installation.
You can either select a detected installation from the dropdown or browse manually to a custom Python folder.
In the example shown, Power BI detected a Python installation in: C:\Users\vijay\AppData\Local\Programs\Python\Python314
If Python is not yet installed in your PC, Here is the 👉 : LINK
Python IDE Selection
Power BI allows you to choose which program should open when editing or running Python scripts.
Examples of available options may include:
- Default OS program for .py files
- Anaconda, VS Code, PyCharm, Spyder, or any IDE installed on your machine
For Anaconda Navigator (IDE), Here is the 👉 : LINK
In the example shown, Power BI is set to use the operating system’s default program for Python files.
Temporary Storage Location
Power BI uses a temporary folder to store files generated while executing Python scripts.
You can change this folder path using the “Change temporary storage location” option.
Security Settings
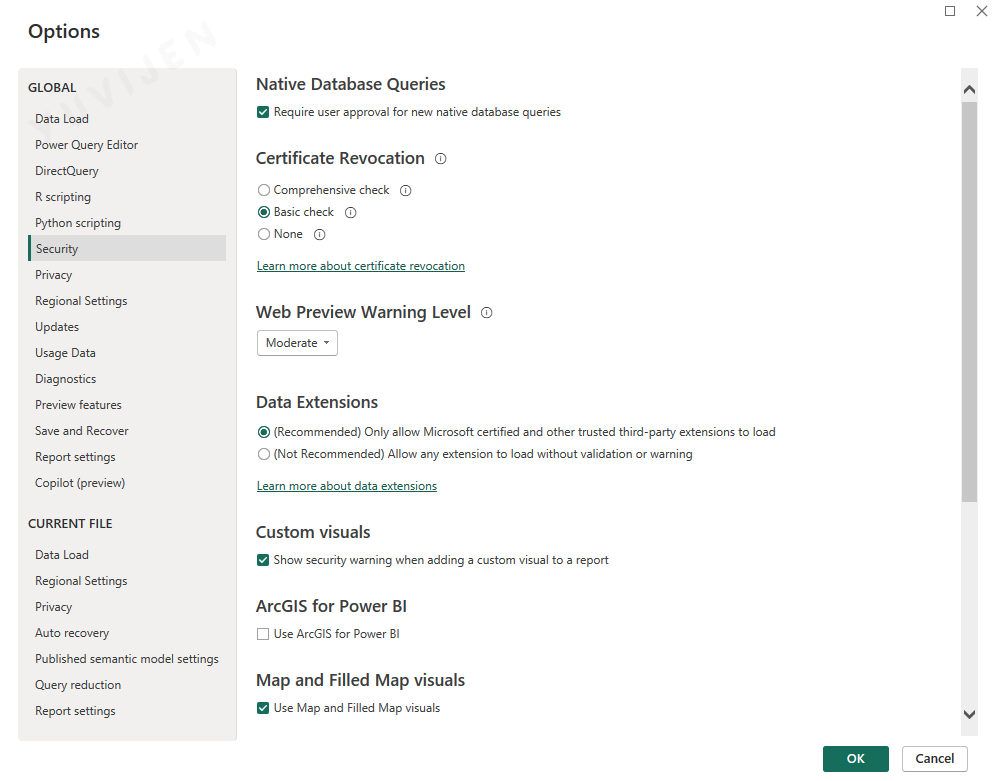
The Security settings in Power BI Desktop control how the application handles native queries, certificate validation, custom visuals, data extensions, and map visuals.
These options help ensure a secure and governed analytics environment, especially when interacting with external data sources or third-party components.
Native Database Queries
Controls whether Power BI requires confirmation before executing new native database queries.
- Require user approval for new native database queries
This setting prevents accidental execution of SQL statements against live databases.
Certificate Revocation
Defines the certificate validation level used when connecting to external sources.
Options include:
- Comprehensive check
- Basic check
- None
The Basic check is selected in the configuration, providing a balanced approach to validation and performance.
Web Preview Warning Level
Specifies the warning level shown when data is imported from web sources.
Available warning levels:
- Low
- Moderate
- High
The current setting is Moderate.
Data Extensions
Controls which third-party connectors Power BI will load.
Options include:
- Allow only Microsoft-certified and trusted extensions (recommended)
- Allow any extension without validation or warning
Restricting to certified extensions is recommended for secure enterprise environments.
Custom Visuals
Controls whether Power BI displays warnings when importing custom visuals.
- Show security warning when adding a custom visual
This helps users verify whether an external visual is safe to use.
ArcGIS for Power BI
Controls access to ArcGIS-based geospatial functionality.
- Use ArcGIS for Power BI
This option is disabled in the current configuration.
Map and Filled Map Visuals
Enables or disables built-in map visuals.
- Use Map and Filled Map visuals
These visuals are enabled.
Preview Features
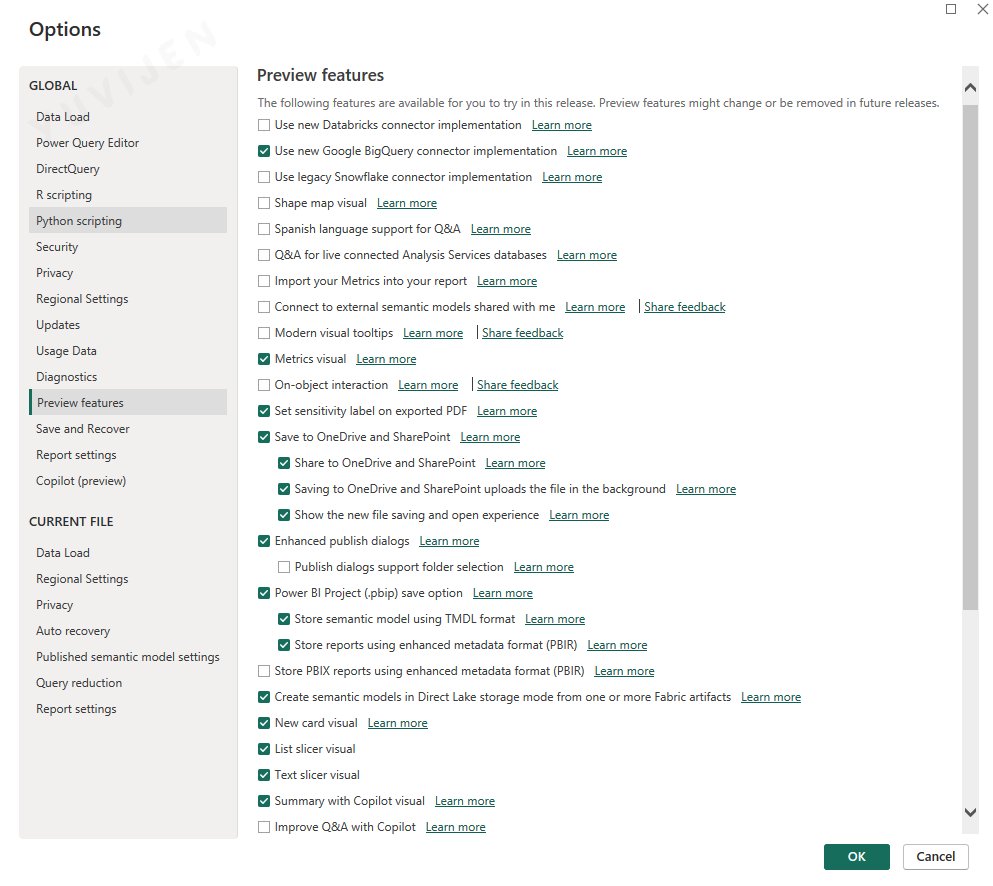
Preview features in Power BI Desktop give early access to new functionalities that are still under development.
These features may change, improve, or be removed in future releases, so they should be enabled with awareness.
They are especially useful for learners, analysts, and developers who want to explore upcoming capabilities before general availability.
Connector and Data Source Previews
These features introduce new or updated connectors:
- Use new Databricks connector implementation
- Use new Google BigQuery connector implementation
- Use legacy Snowflake connector implementation
These options provide early versions of revised connectors and may affect connection behavior when working with cloud data sources.
Visuals and Interaction Features
Preview options related to visuals, formatting, and user experience:
- Shape map visual
- Modern visual tooltips
- Metrics visual
- On-object interaction
- New card visual
These features enhance visualization capabilities and support new interactions inside the report canvas.
Data Modeling and Semantic Model Features
Options that affect dataset creation, storage, and metadata:
- Import your Metrics into your report
- Connect to external semantic models shared with me
- Create semantic models in Direct Lake storage mode
- Store semantic model using TMDL format
- Store reports using enhanced metadata format (PBIR)
- Store PBIX reports using enhanced metadata format (PBIR)
These features help users work with advanced modeling, Fabric integrations, and new metadata formats.
Saving, Publishing, and Collaboration
Features related to saving files, sharing, and cloud publishing:
- Save to OneDrive and SharePoint
- Share to OneDrive and SharePoint
- Saving to OneDrive and SharePoint uploads the file in the background
- Show the new file saving and open experience
- Enhanced publish dialog
- Power BI Project (.pbip) save option
These options improve integration with cloud-based storage and publishing workflows.
Other Preview Enhancements
Additional preview options include:
- Spanish language support for Q&A
- Q&A for live connected Analysis Services databases
- Set sensitivity label on exported PDF
These features introduce improvements in multilingual Q&A and sensitivity labeling.
Report Settings
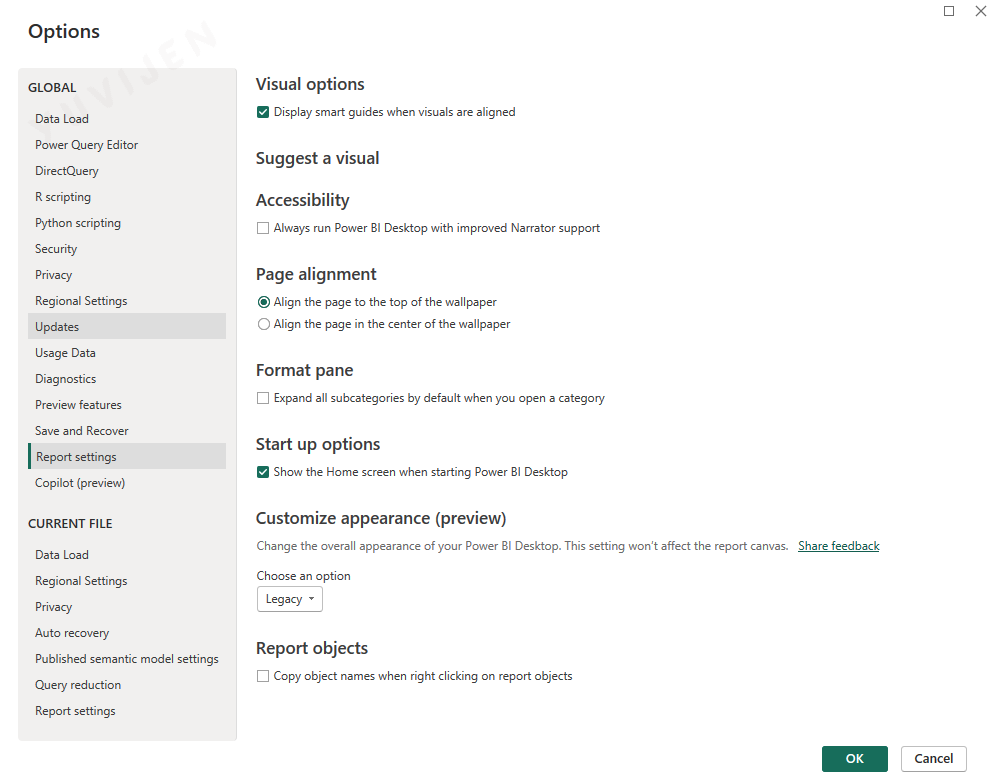
Report Settings in Power BI Desktop control visual alignment assistance, accessibility preferences, startup behavior, appearance options, and object naming rules inside the report canvas.
These settings help you customize how you work with visuals and how Power BI Desktop behaves when launching or interacting with reports.
Visual Options
This setting improves visual alignment while designing reports:
- Display smart guides when visuals are aligned
Smart guides make it easier to maintain consistent layout and spacing across visuals.
Suggest a Visual
This enables Power BI to suggest alternative visual types based on your selected fields.
Useful for beginners, but optional for experienced users.
Accessibility
Controls accessibility features for screen readers and enhanced narrator support:
- Always run Power BI Desktop with improved Narrator support
This option is primarily helpful for users requiring assistive technologies.
Page Alignment
Determines how the report page aligns relative to the wallpaper:
- Align the page to the top of the wallpaper
- Align the page in the center of the wallpaper
Choosing top alignment provides a cleaner layout for standard report designs.
Format Pane
Controls expansion behavior inside the formatting pane:
- Expand all subcategories by default when you open a category
This is useful when you want to avoid repeatedly expanding formatting sections.
Start-up Options
Defines what appears when Power BI Desktop starts:
- Show the Home screen when starting Power BI Desktop
This screen provides quick access to recent files, learning content, and templates.
Customize Appearance (Preview)
Changes the visual theme of the Power BI Desktop interface:
- Choose an option (Legacy or new preview theme)
This does not affect the report canvas—only the application interface.
Report Objects
Controls how object names behave during right-click actions:
- Copy object names when right-clicking on report objects
This can be useful when documenting visuals or building data dictionaries.
3.3.2 Current File Settings
Current file settings apply only to the open .pbix report.
These determine how the specific report loads, models, and displays data.
Data Load
The Data Load settings under the Current File category control how Power BI handles data types, relationships, preview loading, and Q&A behavior for the specific report you are working on.
These settings do not affect other reports and allow you to fine-tune performance and modeling behavior for the current .pbix file.
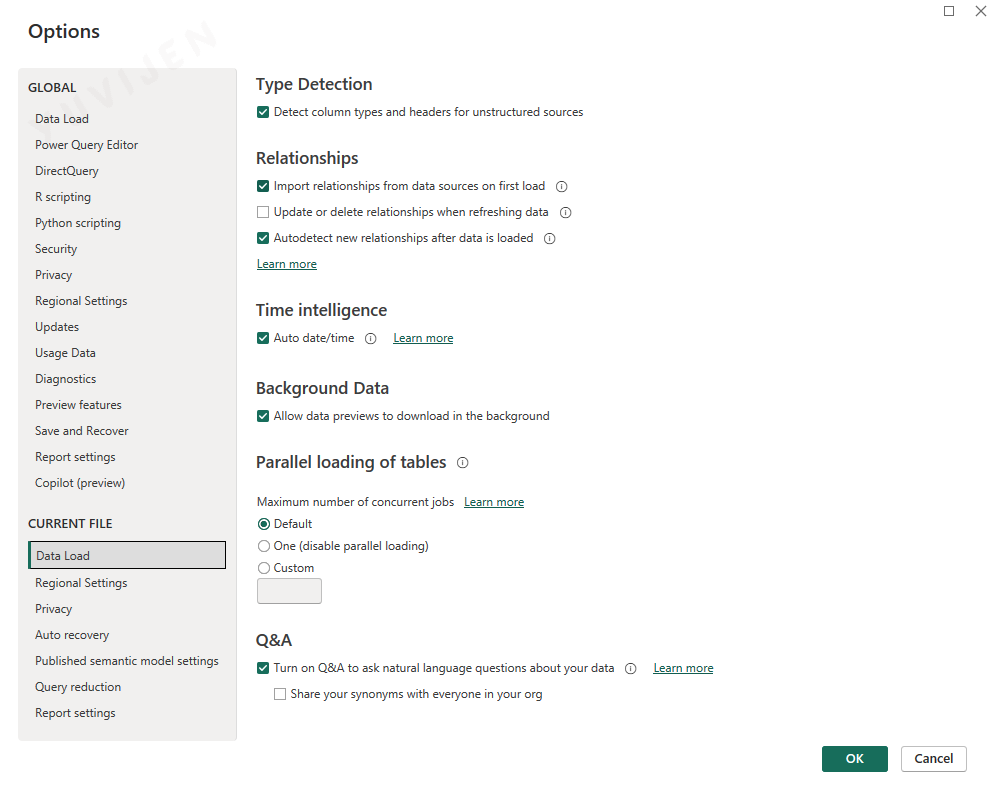
Type Detection
Controls automatic identification of column types and headers when loading data from unstructured sources.
- Detect column types and headers for unstructured sources
This ensures cleaner data imports for text and CSV sources.
Relationships
Defines how Power BI handles table relationships during data loading and refreshes.
Options include:
- Import relationships from data sources on first load
- Update or delete relationships when refreshing data
- Autodetect new relationships after data is loaded
The configuration shown enables importing and autodetecting relationships, while avoiding automatic modifications during refresh.
Time Intelligence
Determines whether Power BI automatically creates internal date tables for date fields.
- Auto date/time
This is convenient for quick analysis but may be disabled in advanced models that use a dedicated Date table.
Background Data
Controls how data previews load inside Power Query.
- Allow data previews to download in the background
This improves responsiveness during transformations.
Parallel Loading of Tables
Specifies how many tables Power BI loads at the same time during refresh.
Options include:
- Default (recommended)
- One (disable parallel loading)
- Custom number of concurrent jobs
Parallel loading can improve refresh performance for large models.
Q&A
Enables natural language query features within the current report.
Options include:
- Turn on Q&A to ask natural language questions about your data
- Share your synonyms with everyone in your organization
This feature helps users explore the dataset using conversational queries.
Query Reduction
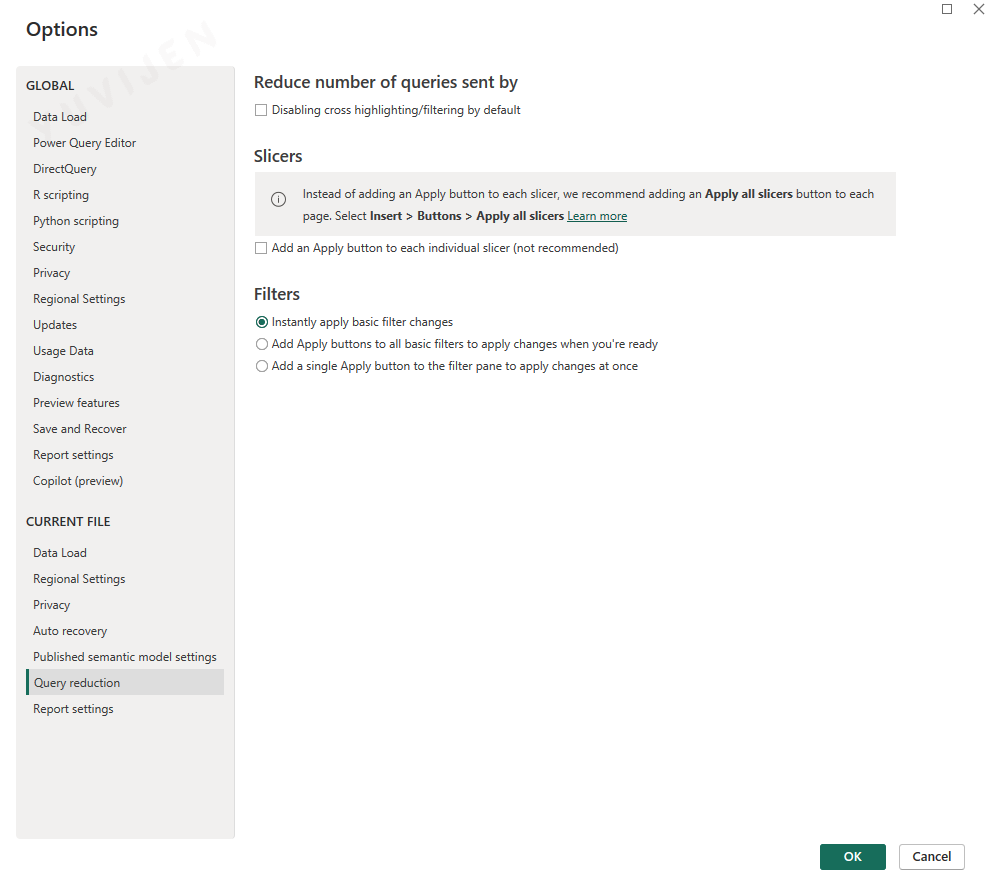
The Query Reduction settings help manage how often Power BI sends queries to the underlying data source.
This can improve performance when working with DirectQuery models or large datasets by reducing unnecessary refreshes during user interactions.
Reduce Number of Queries
This option controls whether Power BI prevents cross-highlighting and filtering from immediately sending queries.
- Disabling cross highlighting/filtering by default
This is mostly relevant for DirectQuery models where each interaction triggers a live query.
Slicers
Defines how slicer selections apply changes to the report.
Options include:
- Adding a recommended “Apply all slicers” button to the page
- Adding an Apply button to each slicer (not recommended due to clutter)
The recommended approach is to use a single Apply All button for better usability and fewer background queries.
Filters
Controls how filter selections are applied.
Options include:
- Instantly apply basic filter changes
- Add Apply buttons to all basic filters
- Add one Apply button to the filter pane
Instant application is selected, providing a smooth experience unless working in DirectQuery, where Apply buttons may improve performance.
Report Settings
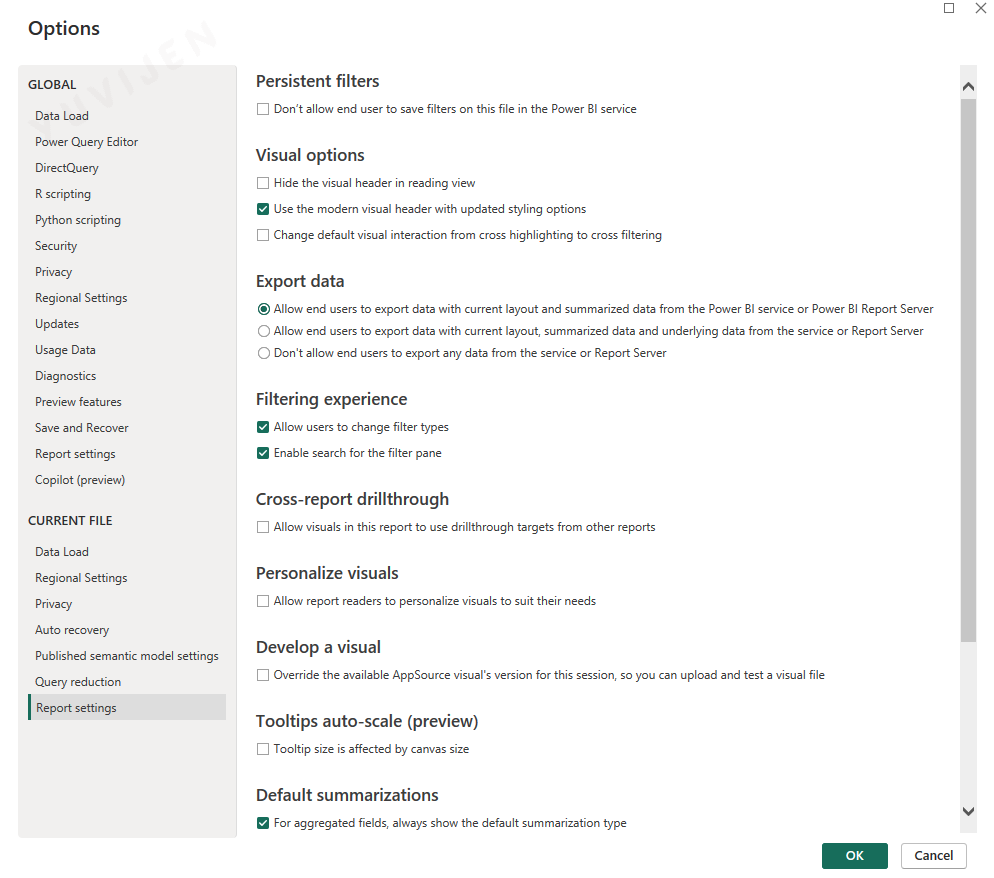
The Report Settings options define how users interact with filters, visuals, exports, and drillthrough capabilities within the current Power BI report.
These settings are specific to the open .pbix file and allow finer control over the user experience.
Persistent Filters
Controls whether the Power BI Service is allowed to remember user-applied filters.
- Don’t allow end users to save filters on this file in the Power BI service
This restricts users from saving personal filter states.
Visual Options
Defines styling and visual behavior within the report.
- Hide the visual header in reading view
- Use the modern visual header with updated styling options
- Change default visual interaction (cross highlighting or cross filtering)
The modern visual header option is enabled in the configuration.
Export Data
Specifies the level of export permission given to users.
Available options include:
- Allow export of summarized data
- Allow export of summarized and underlying data
- Disable export altogether
The configuration shown enables export of summarized data only.
Filtering Experience
Controls how users interact with report filters.
Options include:
- Allow users to change filter types
- Enable search inside the filter pane
Both enhancements are enabled to improve usability.
Cross-Report Drillthrough
Determines whether visuals in the current report can drill through to related reports.
- Allow drillthrough to targets from other reports
This is disabled in the configuration.
Personalize Visuals
Allows end users to customize visuals during consumption.
- Allow report readers to personalize visuals
This is disabled, maintaining a controlled report experience.
Develop a Visual
Enables developers to test custom visuals by overriding AppSource versions.
- Override visual’s version for this session
Useful only for custom visual development scenarios.
Tooltips Auto-Scale (Preview)
Controls how tooltip size responds to the report canvas.
- Tooltip size adjusts with canvas size
This setting is optional and currently disabled.
Default Summarization
Controls summarization defaults for aggregated fields.
- Always show the default summarization type
This helps maintain consistent aggregation behavior across visuals.
3.3.3 Data Source Settings
The Data Source Settings window allows you to manage credentials, permissions, and connection behavior for all data sources used in Power BI.
These settings help control security, privacy, and reliability when connecting to external files, databases, or online services.
Data Sources in Current File
This view shows all data sources that the current report is connected to.
You can select an item from the list and perform actions such as:
- Change Source
- Edit Permissions
- Clear Permissions
- Export .pbids connection file
This is the safest way to revise file paths or switch between test and production data sources.
Global Permissions
This tab manages the credentials Power BI has stored across all reports on the machine.
It includes permissions for:
- Databases
- Online services
- Local folders
- Web APIs
Clearing credentials here resets access across all reports, which is useful when login details change or outdated connections cause errors.
Edit Permissions
This option lets you update how Power BI authenticates to a data source.
You can modify:
- Authentication method
- Privacy level
- Stored credentials
Adjusting privacy levels helps Power BI decide whether to isolate queries or combine data sources.
Clear Permissions
Removes stored credentials for the selected data source.
This is helpful when:
- Data access has changed
- You need to re-enter authentication
- The report fails due to credential mismatch
After clearing permissions, Power BI will prompt for credentials again the next time the report refreshes.
Change Source
Allows you to update the file path, server name, database name, or URL linked to the data source.
This is especially useful when moving between:
- Local → cloud paths
- Development → production servers
- Static files → updated versions