flowchart TB

    %% LEFT COLUMN
    A1["<b>🔗 Data Connection</b><br/>Connect to Excel, SQL, cloud services"]
    A2["<b>🛠️ Data Transformation</b><br/>Clean & standardize using Power Query"]
    A3["<b>📐 Data Modeling</b><br/>Define relationships & create measures with DAX"]

    %% RIGHT COLUMN
    B1["<b>📊 Visualization</b><br/>Build dashboards with charts, KPIs, and maps"]
    B2["<b>☁️ Publishing & Sharing</b><br/>Publish to Power BI Service"]
    B3["<b>⏱️ Scheduled Refresh</b><br/>Automate dataset updates"]

    %% GRID LAYOUT
    A1 --- B1
    A2 --- B2
    A3 --- B3

    %% FLOW DOWNWARD
    A1 --> A2 --> A3
    B1 --> B2 --> B3

    classDef default fill:#004466,color:#ffffff,stroke:#ffcc00,stroke-width:3px,rx:10px,ry:10px;
2 Introduction to Power BI
2.1 Power BI
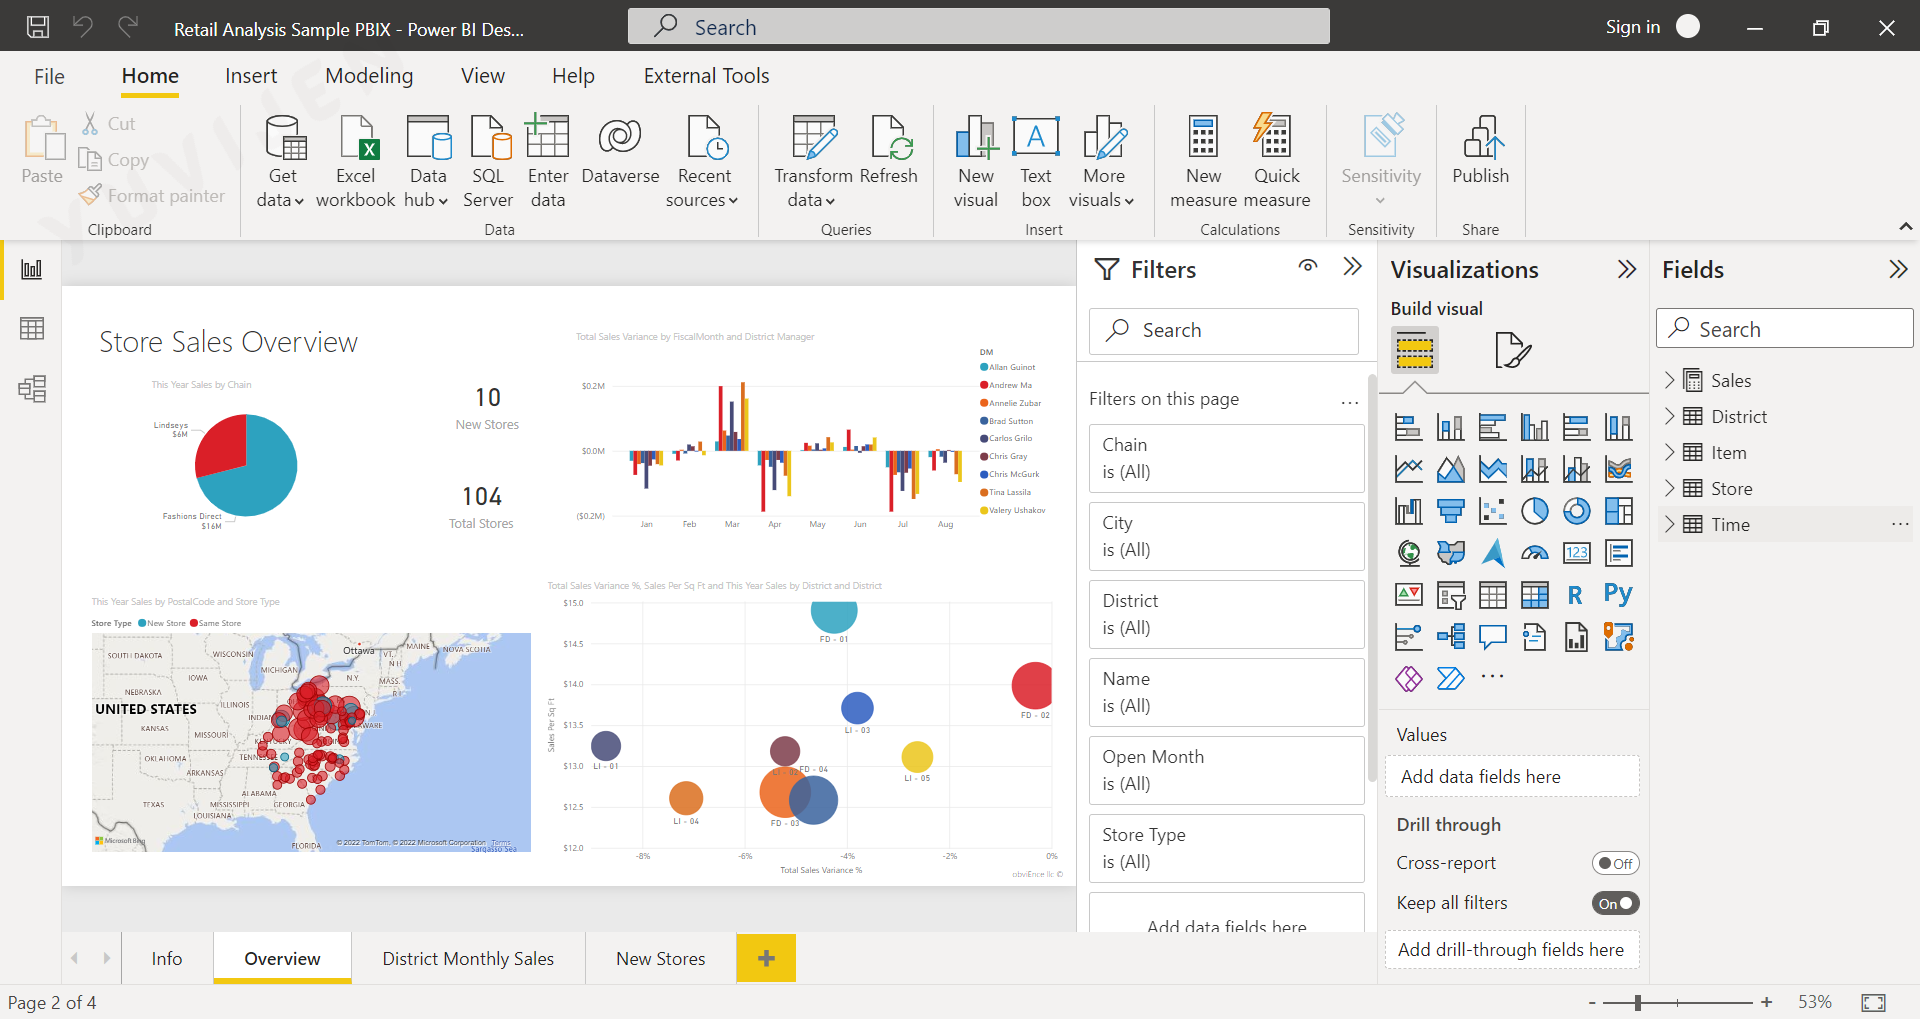
Microsoft Power BI is a comprehensive business analytics platform that allows users to connect to diverse data sources, transform raw information, and build interactive dashboards and reports.
It enables individuals and organizations to make informed decisions by turning complex datasets into clear and meaningful visual insights.
Power BI brings together data integration, data modeling, and data visualization into a single unified environment.
Its ease of use, scalability, and advanced analytical capabilities make it one of the most widely adopted tools in Business Intelligence.
2.2 Core Functions of Power BI
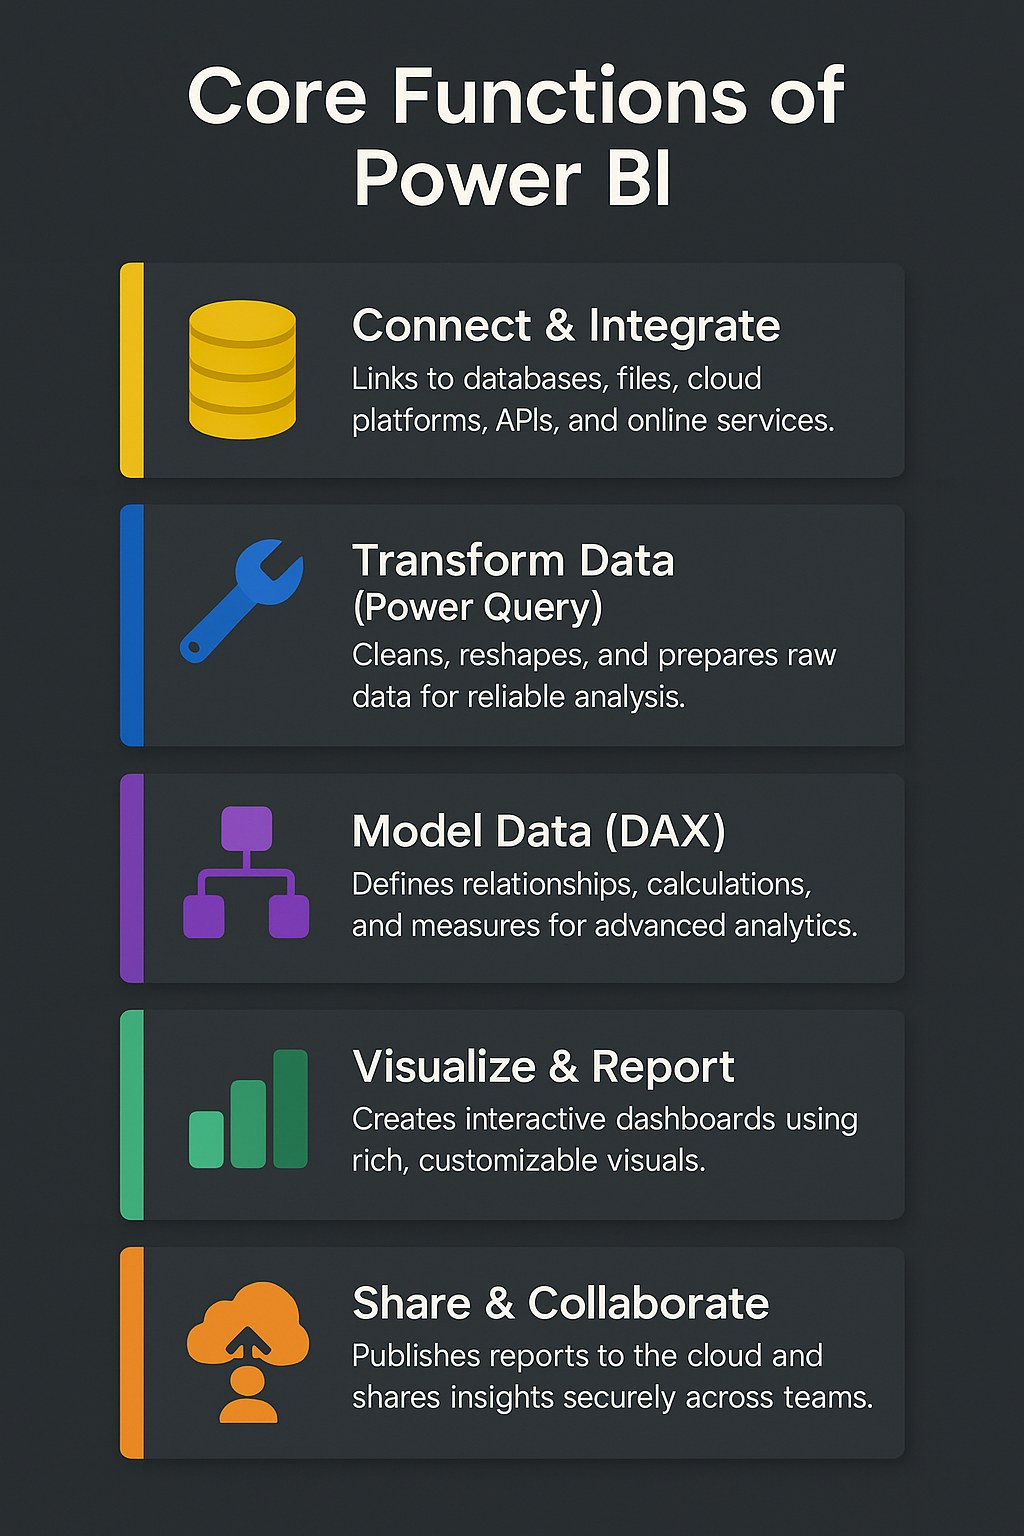
By centralizing these capabilities, Power BI reduces the gap between raw data and strategic decisions making analytics accessible, interactive, and impactful for all levels of users.
2.3 Power BI Ecosystem
The Power BI Ecosystem consists of interconnected applications and services that collectively deliver end-to-end analytics — from data connection to collaborative insight sharing.
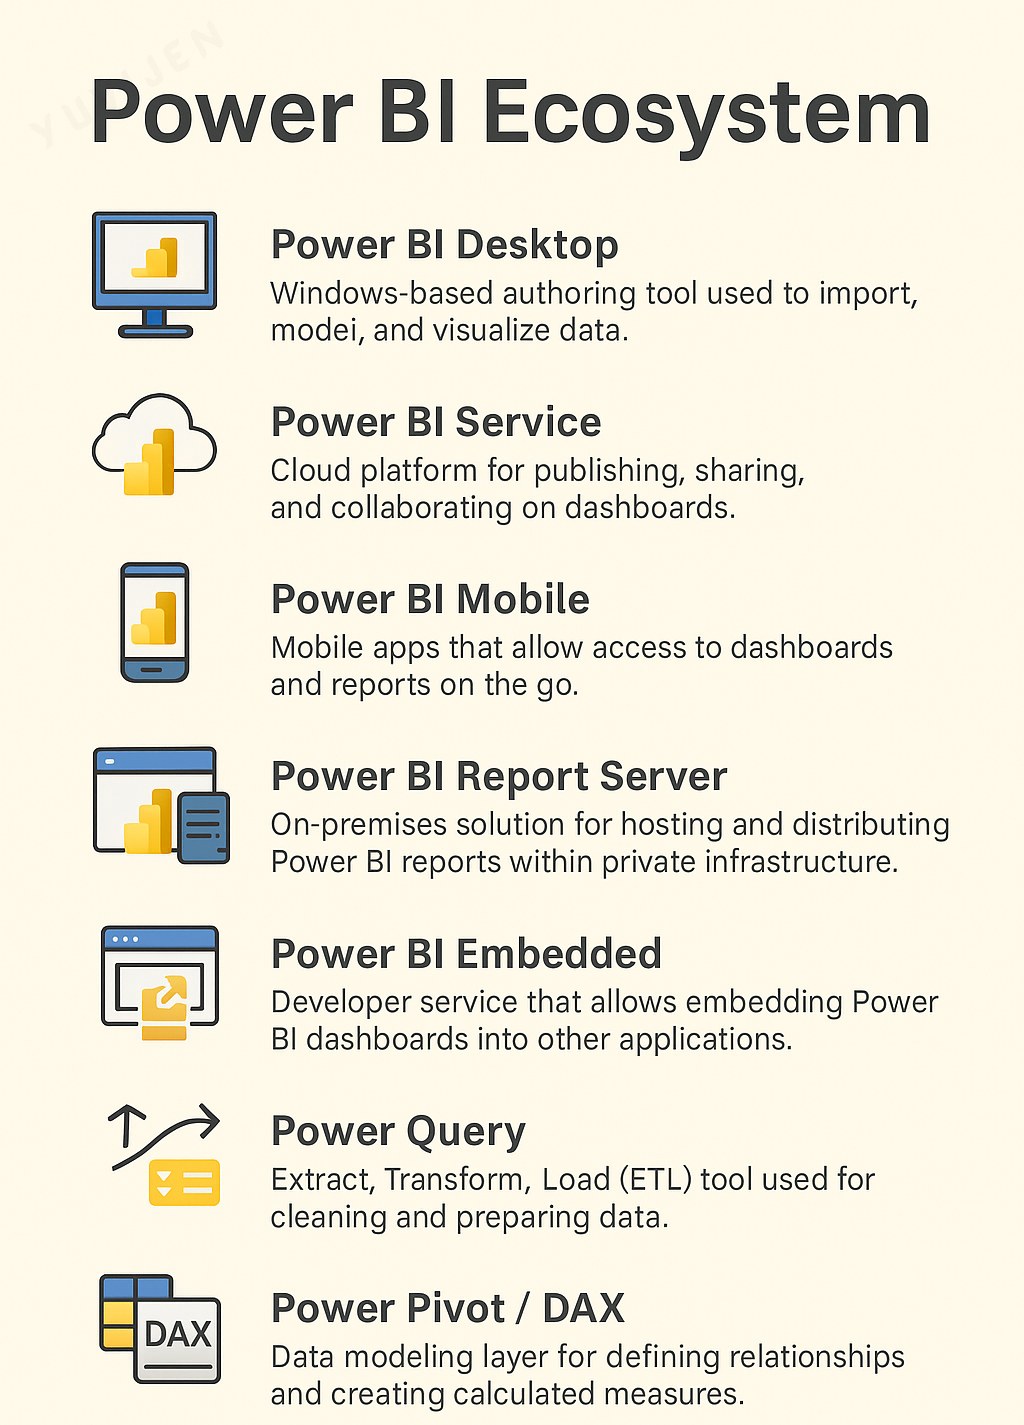
Together, these components form a robust and flexible analytics environment that scales easily from individual users to enterprise-level implementations.
2.4 Power BI Architecture and Workflow
2.4.1 Power BI Architecture
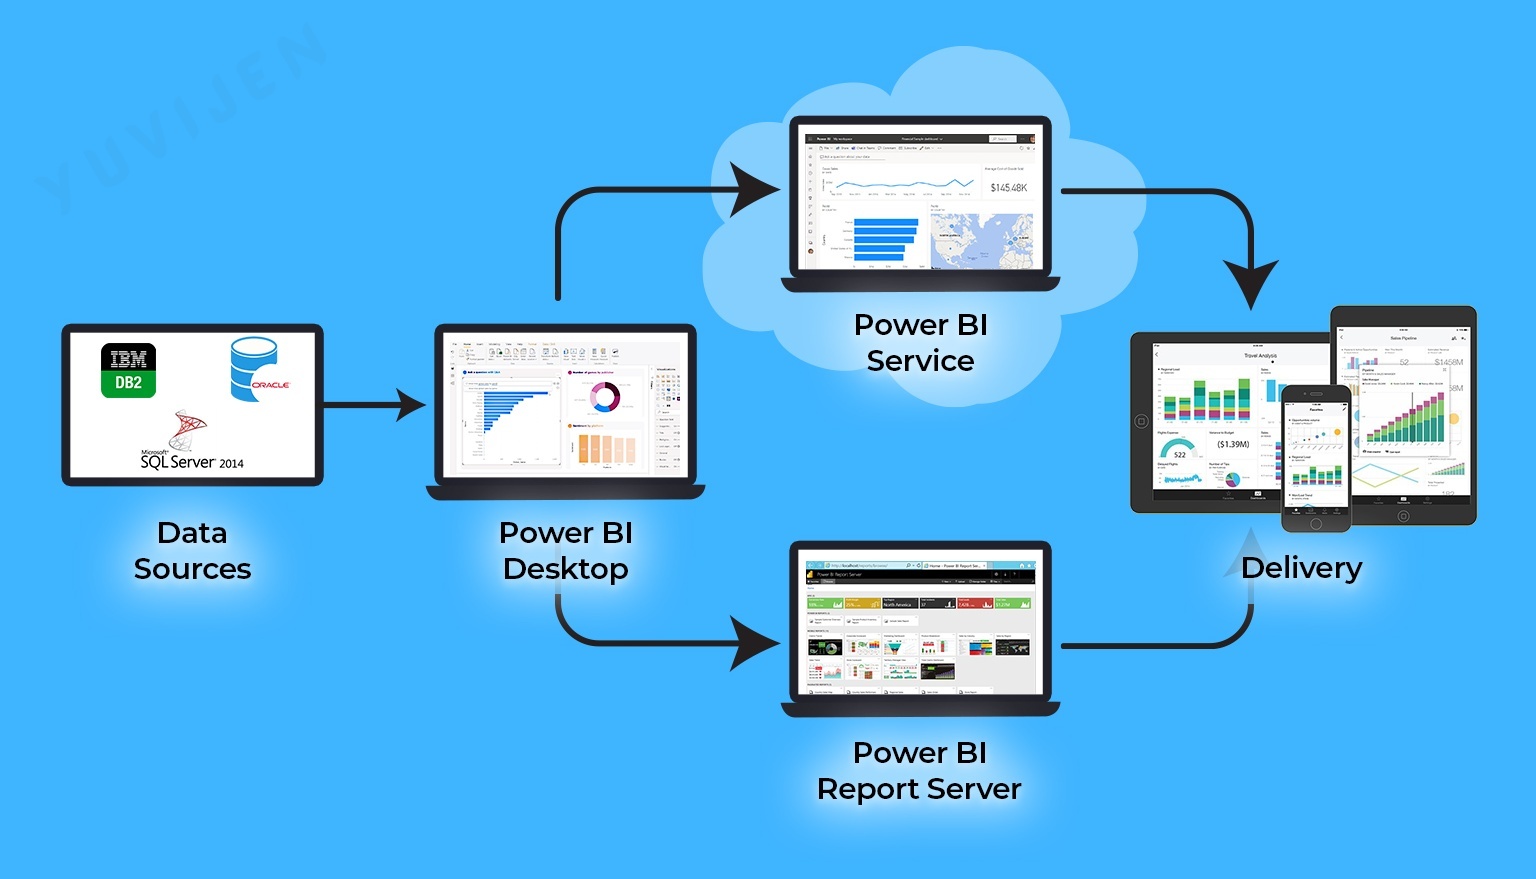
The architecture of Power BI consists of multiple components that work together to ensure seamless data integration, processing, and visualization. The image illustrates the key components of Power BI architecture and their interactions.
Power BI can connect to a wide variety of data sources, enabling comprehensive data integration across systems.
-
Relational Databases: SQL Server, IBM DB2, Oracle, MySQL
-
Cloud-based Data Services: Azure SQL Database, Google BigQuery, Amazon Redshift
-
Flat Files: Excel, CSV, XML, JSON
- Online Services: Google Analytics, Salesforce, SharePoint
Data from these sources is imported or connected live to Power BI for processing and visualization.
Power BI Desktop is the primary tool used by analysts to prepare, model, and visualize data.
-
Data Preparation: Import and clean data using Power Query
-
Data Modeling: Define relationships and create DAX measures
- Visualization: Build charts, maps, KPIs, and reports
Reports can be published to Power BI Service or Power BI Report Server.
Power BI Service is a cloud-based analytics platform for sharing and collaborating on reports.
-
Sharing dashboards with stakeholders
-
Automatic data refresh
- Access management using RLS
It enables real-time collaboration and browser-based access.
Designed for organizations requiring an on-premises reporting environment.
-
Private infrastructure hosting
-
Browser access without cloud dependency
- SSRS support for paginated reports
Ideal for enterprises with strict security and regulatory needs.
Power BI offers flexible accessibility across platforms:
-
Web Browsers: View dashboards via Power BI Service
-
Mobile Apps: Access insights via iOS/Android
- Embedded Apps: Integrate Power BI into custom apps
Ensures consistent, seamless reporting across devices.
2.4.2 Power BI Workflow
This workflow simplifies the entire process of business analytics — enabling users to move seamlessly from raw data to insight-driven decisions within a single platform.
2.5 Applications of Power BI
Power BI is used across industries to drive performance monitoring, predictive analytics, and strategic planning.
Its versatility and integration capabilities make it a preferred tool for multiple business domains.
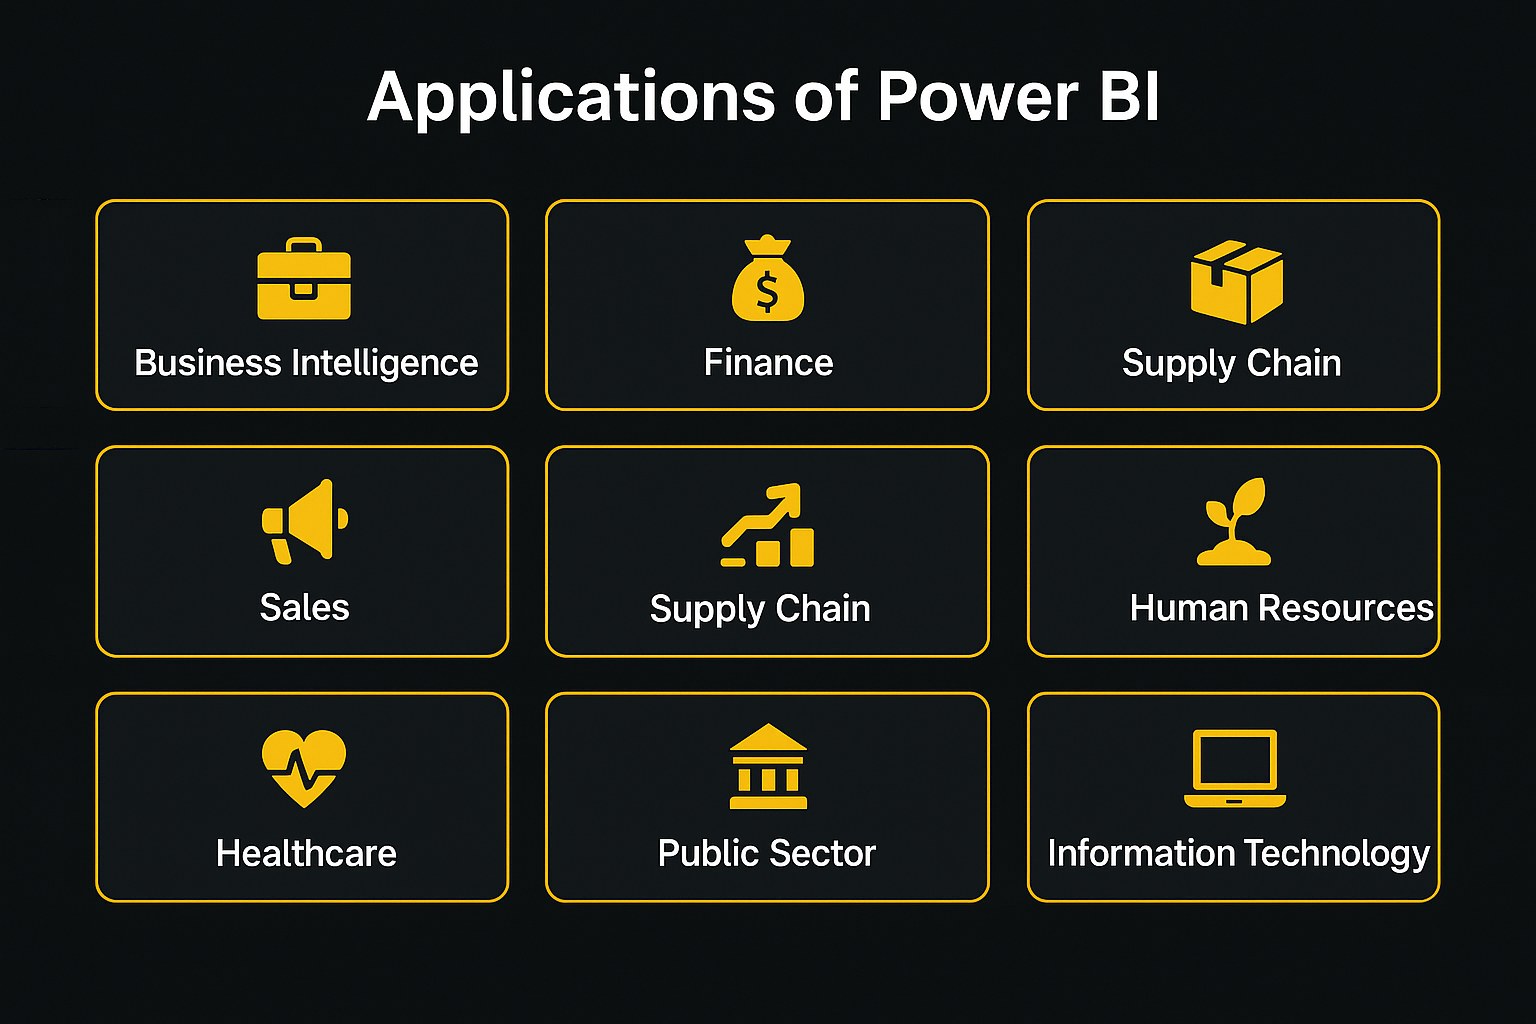
| Domain | Typical Analytics & Reporting Use Cases |
|---|---|
| Business Intelligence & Reporting | Executive dashboards and KPI tracking |
| Finance & Accounting | Expense management, forecasting, and profitability analysis |
| Sales & Marketing | Customer segmentation, campaign performance, and lead conversion |
| Supply Chain & Logistics | Inventory tracking, demand forecasting, and vendor analysis |
| Human Resources | Workforce analytics, attrition trends, and performance management |
| Healthcare | Patient outcomes, resource utilization, and hospital management |
| Retail & E-Commerce | Product performance, pricing optimization, and sales analytics |
| Agriculture | Yield prediction, soil analysis, and weather impact assessment |
| Public Sector | Budget management, policy analysis, and citizen engagement |
| Information Technology | Project tracking, system uptime, and cybersecurity analytics |
Across these areas, Power BI empowers organizations to make informed, timely, and data-backed decisions that enhance efficiency and competitiveness.
2.6 Key Features of Power BI
Power BI provides a rich set of features that enable users to analyze, visualize, and share insights effectively across teams and departments.
Its strength lies in combining self-service analytics with enterprise-level data governance and performance.
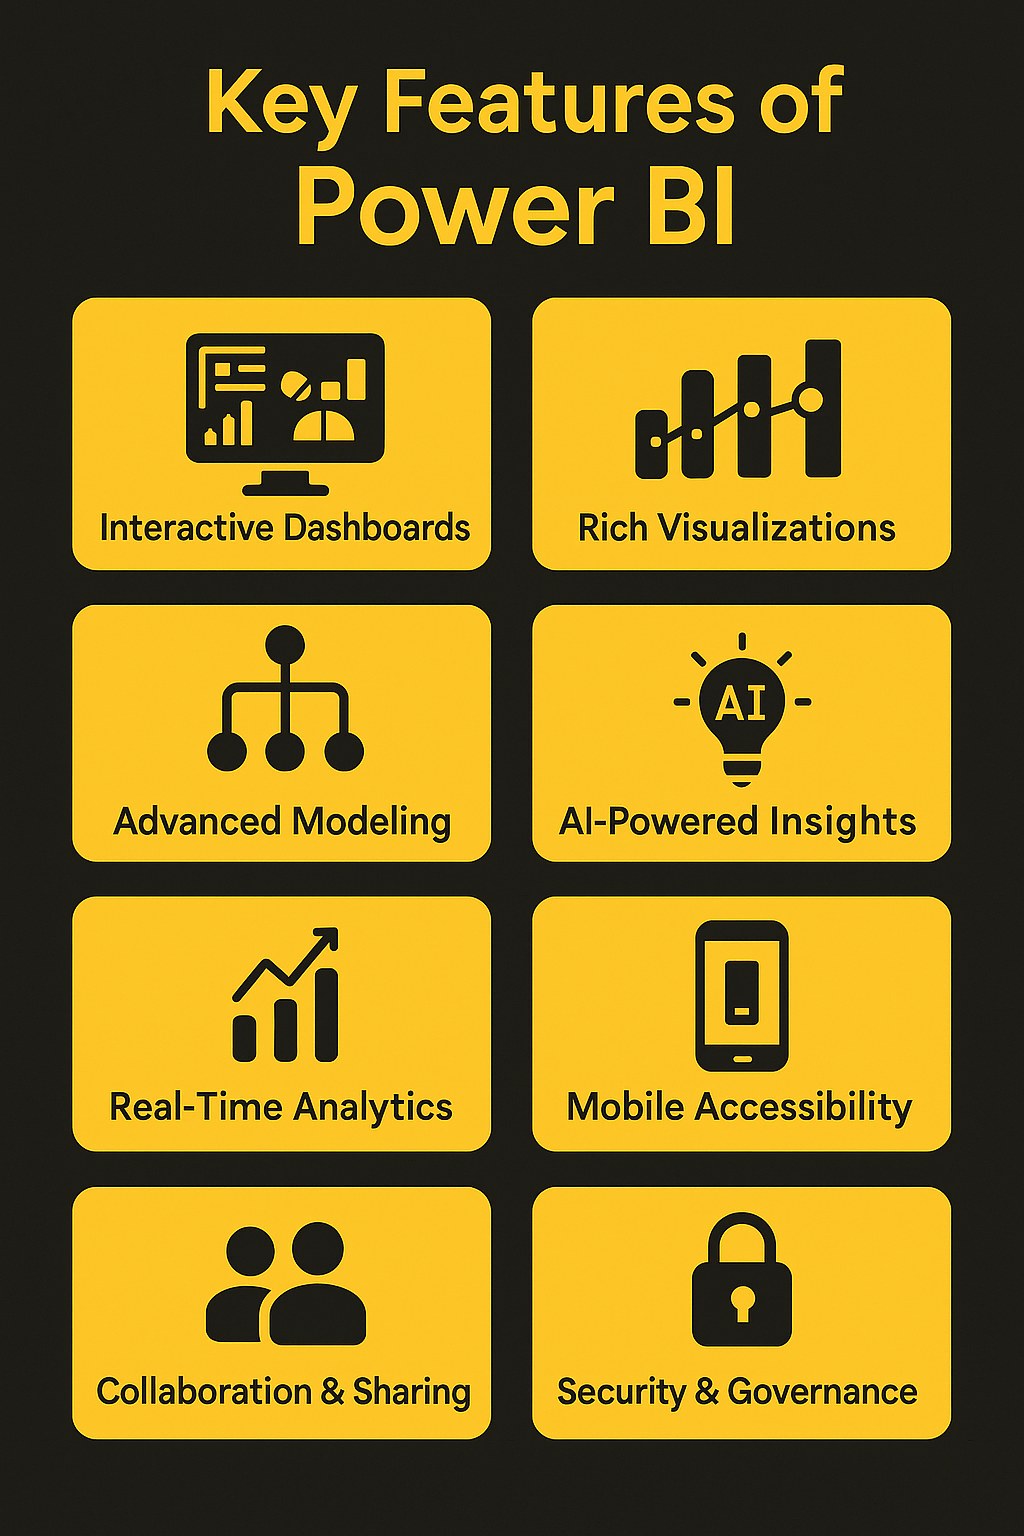
| Feature | Description |
|---|---|
| Interactive Dashboards | Allow dynamic filtering and drill-down analysis |
| Rich Visualizations | Wide variety of built-in and custom visuals for storytelling |
| Data Connectivity | Integrates with on-premises and cloud-based data sources |
| Advanced Modeling | Supports calculations, hierarchies, and aggregations using DAX |
| AI-Powered Insights | Uses Microsoft AI for natural language queries and automated insights |
| Real-Time Analytics | Monitors live data streams for up-to-date business metrics |
| Collaboration & Sharing | Publishes and shares reports through Power BI Service and Teams |
| Mobile Accessibility | Access dashboards from anywhere using the mobile app |
| Security & Governance | Provides Row-Level Security (RLS) and role-based permissions |
These features make Power BI a comprehensive analytics platform suitable for diverse business needs from departmental dashboards to enterprise-wide reporting systems.
2.7 Key Learning Points
- Data visualization is a critical step in turning analytical results into actionable business understanding.
- Power BI integrates all key stages of analytics — from data connection and modeling to visualization and collaboration.
- Its ecosystem supports both individual and organizational analytics needs through accessibility, scalability, and governance.
- Building proficiency in Power BI lays the foundation for mastering advanced analytics, DAX calculations, and interactive dashboard design explored in later chapters.
Summary
| Concept | Description |
|---|---|
| Platform Overview | |
| Power BI Suite | Microsoft's end-to-end BI platform spanning desktop, cloud, and mobile |
| Power BI Desktop | Authoring tool for connecting, modeling, and designing reports |
| Power BI Service | Cloud platform for sharing, refreshing, and collaborating on content |
| Power BI Mobile | iOS, Android, and Windows apps for consuming reports on the go |
| Building Blocks | |
| Power BI Components | Datasets, dataflows, reports, dashboards, gateways, and apps |
| Workspaces and Apps | Containers and packaged content used to share assets with users |
| Data Connectivity | Connectors for files, databases, online services, and custom APIs |
| Power BI Strengths | Tight Microsoft 365 integration, AI features, and active community |